A hunger map of Zimbabwe

According to a report in Farmer’s Weekly (May 29 2013) Minister of Public Works Thulas Nxesi praised Zanu-PF government’s policies of racial land redistribution in Zimbabwe at a recent function attended by farm workers and labour unions in Mbombela, Mpumalanga. Nxesi told his audience: “The land reform movement in Zimbabwe has been successful: 6 000 white owners were replaced by over 200 000 small black farmers. Under white ownership, the farms employed around 250 000 workers. Today, around 1 million derive a living from smaller scale commercial farming.”
Below are two extracts from the World Food Programme project document “Responding to Humanitarian Needs and Strengthening Resilience to Food Insecurity – Zimbabwe” (January 18 2013) that was presented to the WFP’s Board in February 2013. The duration of the project is from May 2013 to April 2013; the maximum expected number of beneficiaries (yearly) is listed as 1,230,000; and the food tonnage requirement is given as 144,021 mt.
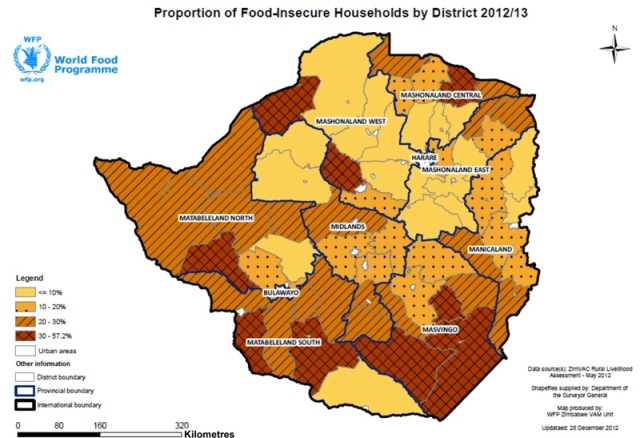
The first extract is the project analysis of the situation in Zimbabwe. The second is a map of the proportion of food insecure households in Zimbabwe derived from the ZimVAC Rural Livelihood Assessment of May 2012.
EXTRACT ONE:
ANALYSIS AND SCENARIO
Context
1. Zimbabwe is a low-income, food-deficit country ranked 173rd of 187 countries on the Human Development Index and 118th of 146 countries on the Gender Inequality Index.1
2. Deteriorating economic conditions between 2000 and 2008 culminated in the collapse of the economy. The country experienced hyperinflation, political turbulence, extensive de-industrialization, large-scale emigration, a significant decline in domestic food production and cuts in human and financial resources for health, education, social services and agriculture. The result is high unemployment and increased poverty.
3. The Global Political Agreement and the introduction of a multi-currency system in 2009 helped to stabilize the economy, facilitate the transition to recovery and promote private-sector engagement to support food security. But the situation remains fragile: Zimbabwe is vulnerable to social, economic, political and climatic shocks.2 General elections are scheduled for early 2013, and there is optimism that social and economic improvements will be political priorities.
4. The number of people living with HIV has decreased in the last decade, but Zimbabwe still has the fifth-highest prevalence in the world at 13.7 percent. Its capacity to fight the disease is limited: only half of the people living with HIV have access to anti-retroviral drugs, and 68 percent of tuberculosis (TB) carriers test positive for HIV.3 The number of new infections is 3 percent annually, and an average of 1,370 people die each week. There are 1.6 million orphans and other vulnerable children.4
5. Recent restrictions by the South African Government on asylum claims from third-country nationals transiting through Zimbabwe and other neighbouring states have increased the number of returnees and asylum-seekers stranded in Zimbabwe.
The Food Security and Nutrition Situation
6. As a result of drought in 2011 and 2012, rural food insecurity in 2013 is projected to be 7 percent higher than in 2012. According to the 2012 Zimbabwe Vulnerability Assessment Committee (ZimVAC) assessment of rural livelihoods,5 1.7 million people – 20 percent of the rural population – will need emergency food assistance during the peak of the lean season early in 2013.
7. Cereal production fell from 1.6 million mt in 2011 to 1.08 million mt in 2012 – a 33 percent decrease from 2011 and the lowest harvest since 2009. With a national cereal requirement of 2.1 million mt, Zimbabwe faces continued deficits.6 Despite the promotion of drought-resistant crop varieties, the area of land planted and agricultural production have declined over the last four seasons.
8. As a result of inadequate cereal production and limited employment opportunities, many rural households consume their food reserves and exhaust their cash assets during the lean season,7 when cereal prices in grain-deficit regions can be twice as high as in grain-surplus regions, typically peaking between December and March.
9. Most livelihoods in drought-prone grain-deficit areas are agriculture-based. Alternative sources of income include non-farm labour, vegetable production, mining, livestock production, trade and increasingly unreliable foreign remittances. The erosion of household assets, typically through distress sales of livestock, has compromised people’s resilience and capacity to cope with shocks.
10. Malnutrition is a serious problem that is seen as the result and driver of poverty. A third of all children are stunted:8 prevalence has increased since 2009 and exceeds 35 percent in 24 of 64 districts; the highest rate of stunting – 47 percent – is in Mutare.9,10 Fewer than 10 percent of children under 2 receive an acceptable diet. Acute malnutrition (wasting) among children appears to be stable at 2.4 percent, but it reaches 19 percent among adults with HIV.11,12
EXTRACT TWO

Footnotes:
1 United Nations Development Programme. 2011.Human Development Report 2011. New York.
2 Zimbabwe is in the World Bank’s list of fragile states with a country policy and institutional assessment of 1.954 – well below the 3.0 cut-off for countries considered to be “core” fragile states.
3 The Ministry of Health and Child Welfare, HIV Annual Report for 2011.
4 Zimbabwe National AIDS Strategic Plan II (2011-2015).
5 ZimVAC rural livelihoods assessment, 2012.
6 Ministry of Agriculture, Mechanization and Irrigation Development, second-round crop and livestock assessment, March 2012.
7 The lean season is October-March, with a peak in January-March.
8 Zimbabwe National Security Agency and Inner City Fund International. 2012.Demographic and Health Survey 2012. Harare.
9 Food and Nutrition Council National Nutrition Survey – 2011.
10 Stunting prevalence of 20-29 percent is “medium”, 30-39 percent is “high” and 40 percent is “very high”. World Health Organization, 1995; see:www.who.int/nutgrowthdb/en
11 WFP monitoring data, 2011.
12 Wasting prevalence of 5-9 percent is “poor”, 10-14 percent is “serious” and above 15 percent is “critical”. World Health Organization, 1995; see:www.who.int/nutgrowthdb/en
Source: World Food Programme
